Security Engineering (SE) WorkbenchReturn to the SE-Workbench Project Page Security Analysis ProcessSecurity Analysis is an engineering process used to evaluate the security qualities or operational metrics of systems. Examples of security qualities and operational metrics include: Risk, Threat, Vulnerability, Resilience and Trustworthiness. The output of Security Analysis may consist of: summary opinions recommendations and action plans; or detailed guidance for security controls and technical specifications for security services, guards and countermeasures.This page describes the elements of Security Analyisis: Process, Logic, Metrics, Visualizations and Information Base.
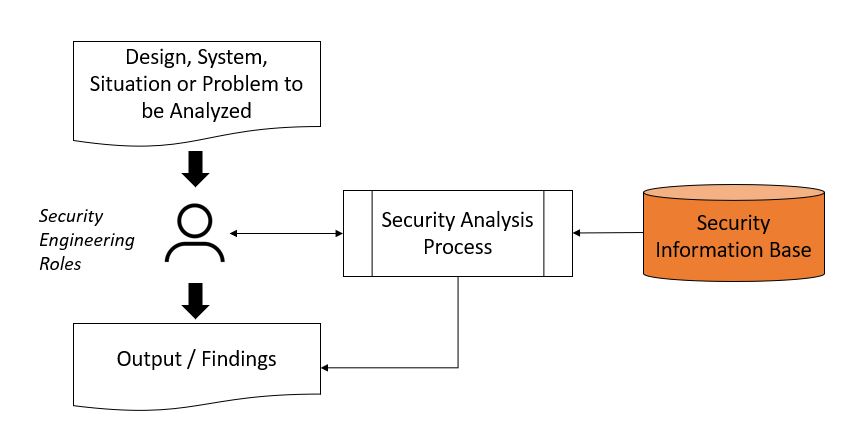
Process OverviewThe basic Security Analysis Process shown in Table #1 below. The left side of the table illustrates to inputs and outputs of a Security Analysis, where the Security Engineer gathers information about the problem to be analysed, to include environment, business and technical parameters and variables, etc. Part of the analysis process includes processing reference information in relation to the problem at hand. The reference information is drawn from authoritative information sources. The right side of the table identifies the basic flow of the Security Analysis process, where the Security Engineer learns about the problem, gathers information about the system being analyzed, performs the analysis and draws conclusions. While not explicitly shown, Security Analysis may be an iterative process that includes hypothesis, testing, measurement and revision to achieve a complete or optimum result or set of conclusions.
Table #1. Basic Security Analysis Process
Security Analysis evaluates the functions and qualities of systems in relation to Threats and Vulnerabilities that are present in the systems' operational environment. Findings for Security Analysis are mapped to Risk, Resilience and/or Trustworthiness. The metrics can be "qualitative" or "quantitative". Qualitative metrics are easy to explain, but hard to rationalize. Quantitative metrics are easy to use for computation, but harder to explain.
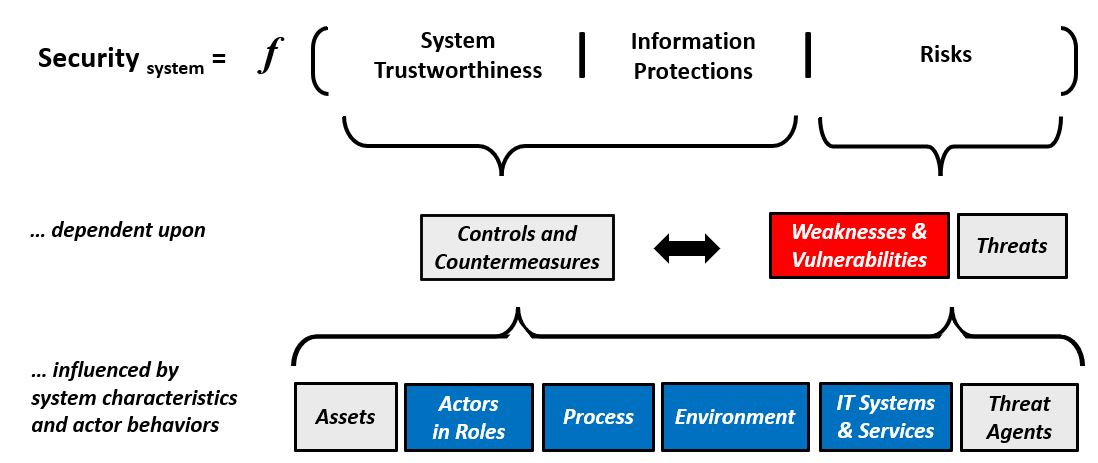
Security Analysis LogicTable #2 provides a view of Relationships and Dependencies that are relevant to Security Analysis. The formula expresses Security of a System as a function of Trustworthiness, Protections and Risks. These elements are dependent upon sets of controls, countermeasures, weaknesses and vulnerabilities. The elements are influenced by the characteristics and behaviors of the people, process, technology and information associated with the system.
Table #2. Security as a Function
Security Analysis MetricsThe output of Security Analysis may be presented as a qualitative or quantitative assessment of risk. Qualitative views of present risk on a scale from Minimum Value to Maximum Value. Quantitative views of risk present or perform calculations on tangible values, physical measurements or verifiable technical guidelines. Table #3 provides examples of qualitative scales and tangible measurements associated with Risk and Risk Calculations. Table #3. Security Assessment Metric Examples
Column A of the table above offers examples of quantitative metrics that reflect the concerns of Owners and other Stakeholders for the system being analyzed. Column B of the table offers a qualitative scale to be used in summary or macro statements about risk, where a rating "Acceptable / Normal" might be used to delineate systems or components with capabilities that meet the criteria for Risk Tolerance. Column C of the table offers a qualitative scale to be used in evaluating severity, likelihood and impact of specific events, attacks or conditions. Each qualitative value is mapped to a numeric value that can be used in risk calculations, where risk is a function of severity, likelihood and impact. These values may be useful when evaluating Risk related to Threats, and Vulnerabilities. Column D offers a qualitative scale for expressing trustworthiness of systems and components, where a rating "Acceptable" might be used to delineate systems or components with capabilities that meet the criteria for Risk Tolerance. Column E illustrates the evaluation criteria for trustworthiness of components from Common Criteria Assurance Requirements. These are used in assessing risk based on the rigor used in development and testing of the systems and components that include security functionality.
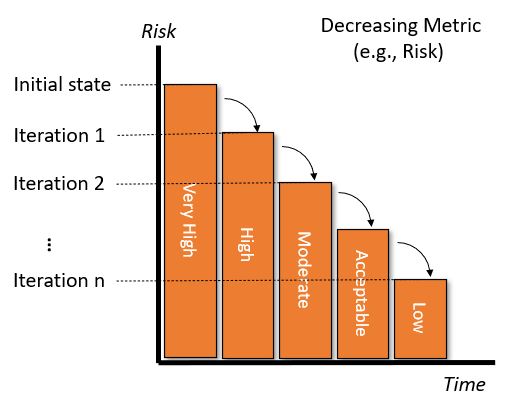
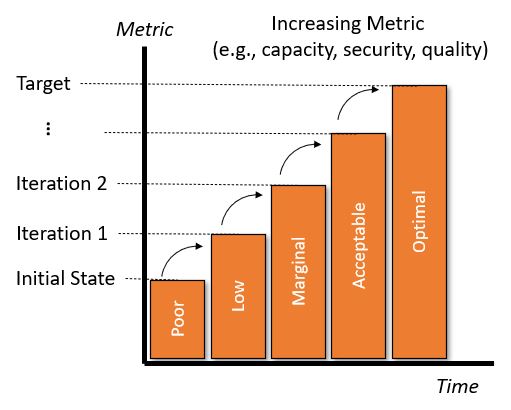
Security Analysis VisualizationsSummary ViewMacro view of the security of a system is a summary opinion. Opinions and guidance about "risk" provide one or more of the following: a statement of risk based on reliable references; a measure of risk for a system with default security controls using a reliable reference; a measure of risk for a system with optimal security controls and countermeasures; a set of actions to reduce risk for a system through a series of measures implemented at one time, or implemented over a series of iterations. Opinions and guidance for "trustworthiness" provide one or more of the following: a statement of trustworthiness based reliable references; a method and means to measure the trustworthiness of a system; a measure of trustworthiness for a system with default security controls and countermeasures; a measure of trustworthiness for a system with optimal security controls and countermeasures; a set of steps to increase trustworthiness of a system through a series of measures implemented at one time, or implemented over a series of iterations. Table #4 demonstrates how Risk or Trustworthiness can be visualized. The left side of the table shows how risk may be viewed as a set of decreasing values using qualitative metrics, and the right side of the table shows how operational metrics may be viewed as a set of increasing values using qualitative metrics.
Table #4. Visualizing Risk or Trustworthiness for Systems
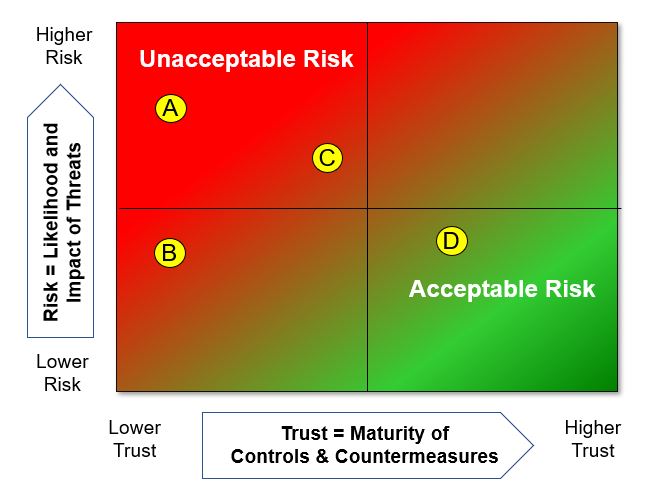
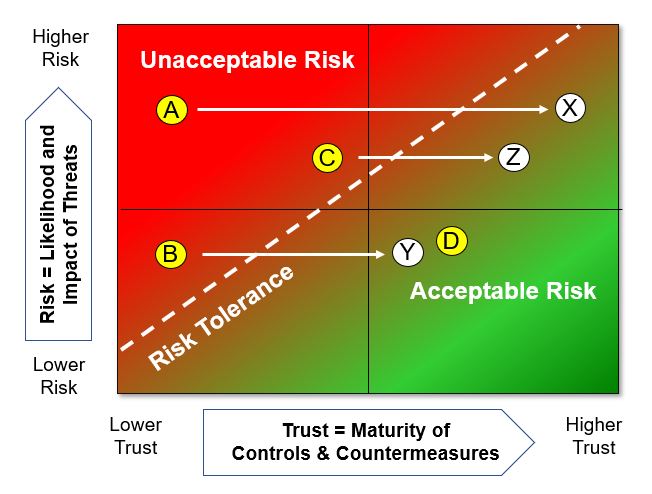
Detailed ViewDetailed view of the security of a system is a can be an evidence based analysis, or a model-based analysis. The graphics in Table #5 help visualize "risk" and its relationship with "trustworthiness". The graphics show "risk" on the vertical axis and "trustworthiness" on the horizontal axis. The left graphic represents "risk" with a series of four events A, B, C and D that are mapped to a grid. The position of the points reflect the "risk" on the vertical scale, and the "trustworthiness" of the related system component or service on the horizontal scale.
Table #5. Visualizing the Effect of Control and Countermeasures on Risk
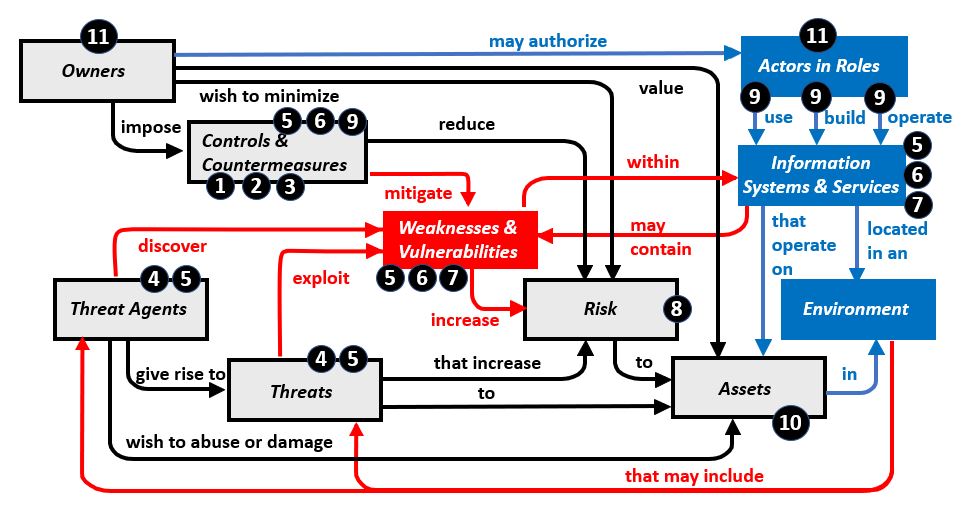
Security Analysis Information BaseSecurity Engineers use security reference information and other data sources in support of Security Analysis. The reference information is created and maintained from a variety of sources, to include: standards bodies, government agencies, professional societies, affinity groups, etc. Each Security Analysis activity requires understanding and applying the content of volumes of security-related reference information. This information is spread across hundreds of documents and thousands of web pages. A Thought Model for Security Analysis of Imperfect Information Technology Systems was introduced in a preceding page. Table #6 below overlays that Thought Model with a set of publicly available security-related reference information.
Table #6 - Authoritative Security Reference Information
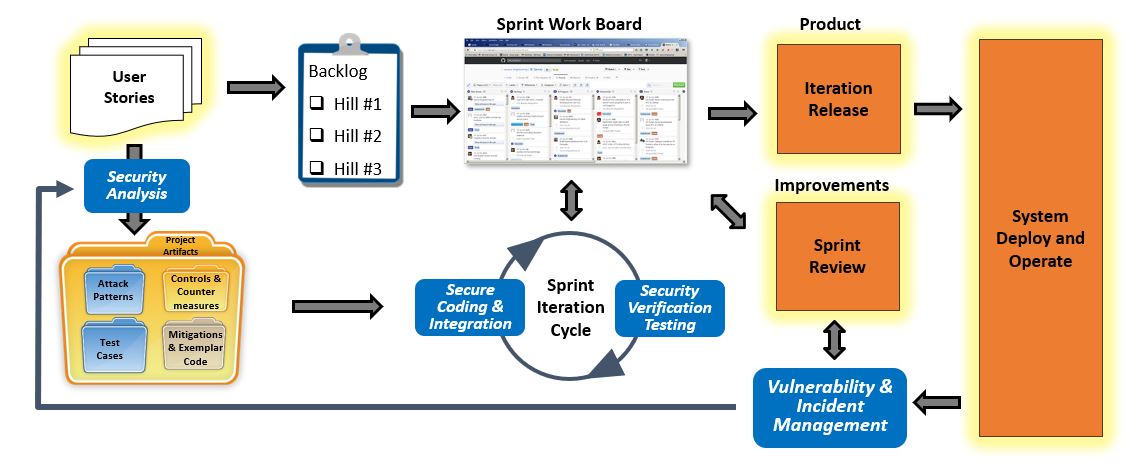
Applied Security Analysis: Systems DevelopmentTable #7 provides a view of the workflow of DevOps style of development that includes Security Analysis. The graphic shows the basic flow of DevOps style of development, where the team creates a catalog of User Stories that are prioritized in the backlog, and scheduled for development sprints. The development sprints yield product functionality that is operationalized. Development controls include: Sprint reviews and and feedback from operations.In the case of SecDevOps, the user stories drive Security Analysis. Artifacts from Security Analysis is merged with the content of Sprints. Security testing and Verification tasks are added to Sprint Iteration Cycle.
Table #7. Security for DevOps
SummaryThis page described the building blocks for Applied Security Analysis: Process, Logic, Metrics, Visualizations and Information Resources.Security Engineers own the task of defining the problem and scope, organizing the tasks, selecting the relevant reference information and performing the analysis, when Security Analysis is performed manually. Given the inherent complexity of Security Analysis, automated tools can simplify the process and enable Security Engineers to consider a broader range of information. The Tools Section of the SE-Workbench Project describes the design and function of tools.
LAST UPDATE: 09 December 2024 |